
Search
On the Search page, you can find a table consisting of all genes that either bind to the genomes or genes for which a regulator bound near the transcription start site (TSS) of the locus. In this table, a gene can be selected ( = query gene) from the table to view its binding events (Fig. 1).
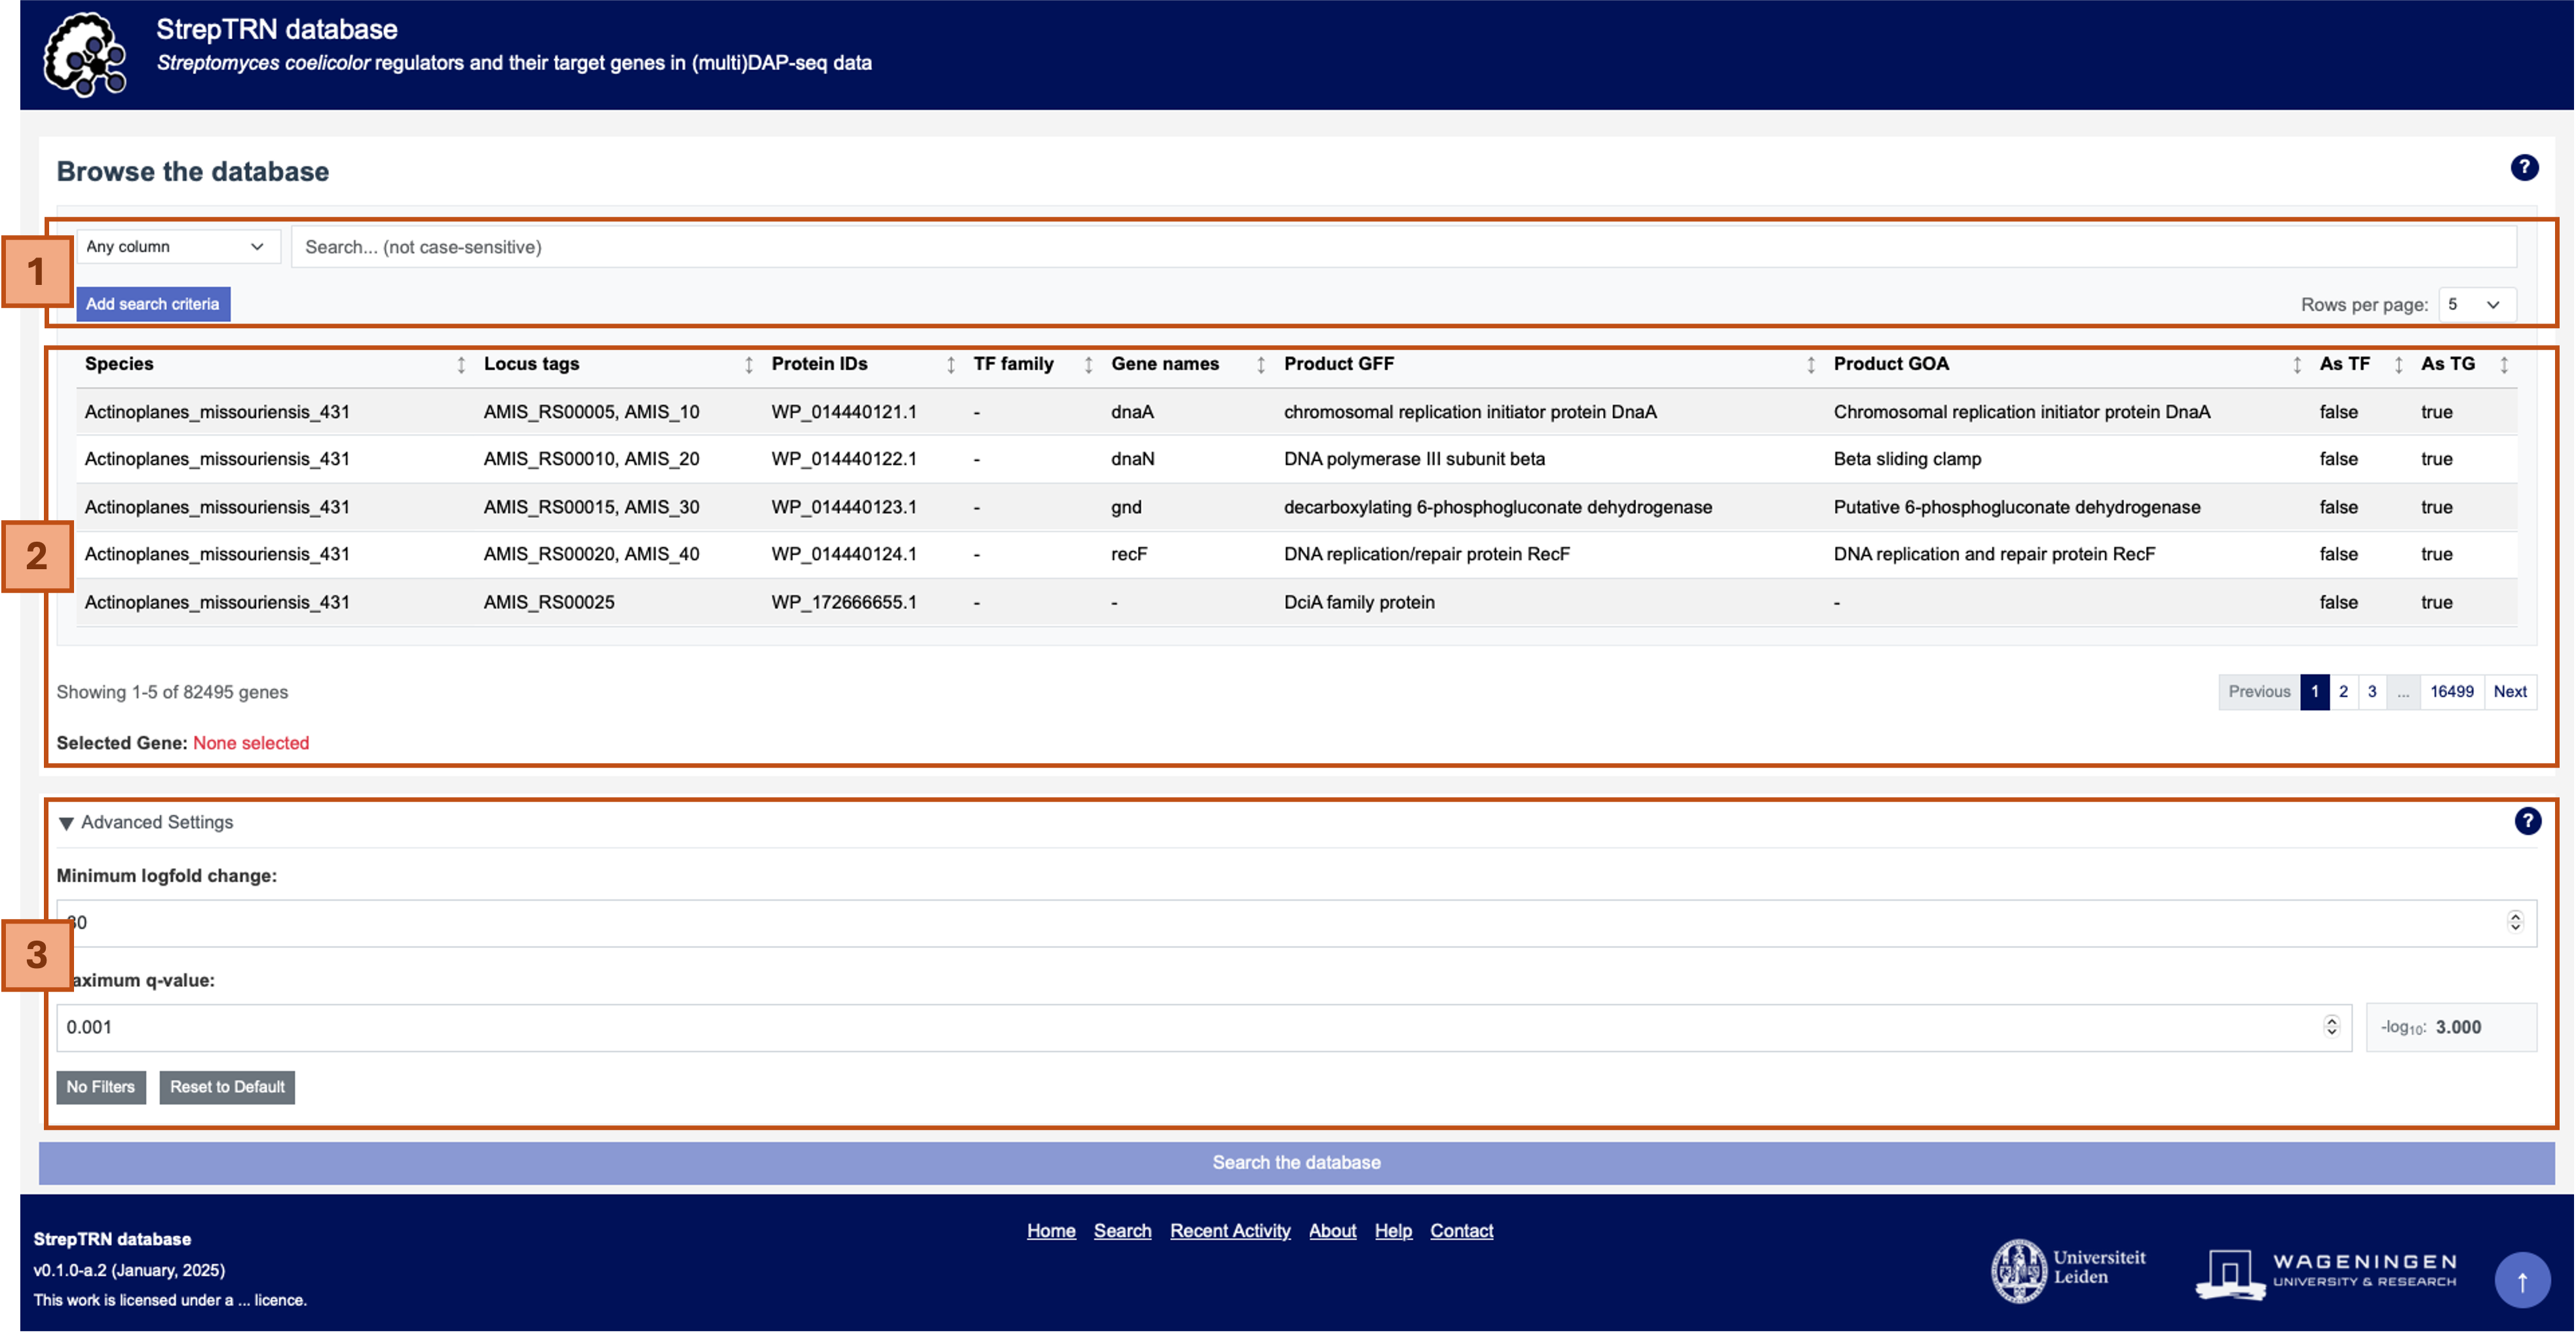
Figure 1 | The Search page, with 1) the search bar, 2) the table with genes, and 3) advanced filtering options.
1) In the search bar, terms can be entered to find a gene, based on their a) identifiers, b)
functional annotation, or c) whether the gene was observed to bind to the genome or had a
regulator bind near its TSS. The "Add search criteria" button can be used if additional filtering is desired.
2) The genes that match the search criteria will appear in the table.
3) Under Advanced Settings, the minimum log fold change, maximum q-value,
and minimum Fraction Reads in Peaks (FRiP) can be specified for the enriched peaks.
The maximum q-value is automatically converted into the -log10 value. The default values correspond to the
thresholds used in the original paper, namely, a minimum log fold change of 30.0, a maximum q-value of 0.005
(= a maximum -log10 q-value of 3.000) and a minimum FRiP-score of 0.

Query
A query can be sent to the servers by selecting a gene via the Search page or building the URL manually following the format:
If no threshold is provided for the q-value, log fold change and/or FRiP in the URL, the default threshold will be used.
After sending a query to the server, a loading bar will show the progress on data retrieval and
visualisation. The processes are divided into three main parts: Overview, Network, and Conservation
of Binding Events (Fig. 2). Once the loading has completed, the results will appear, organised under tabs (Fig. 3).
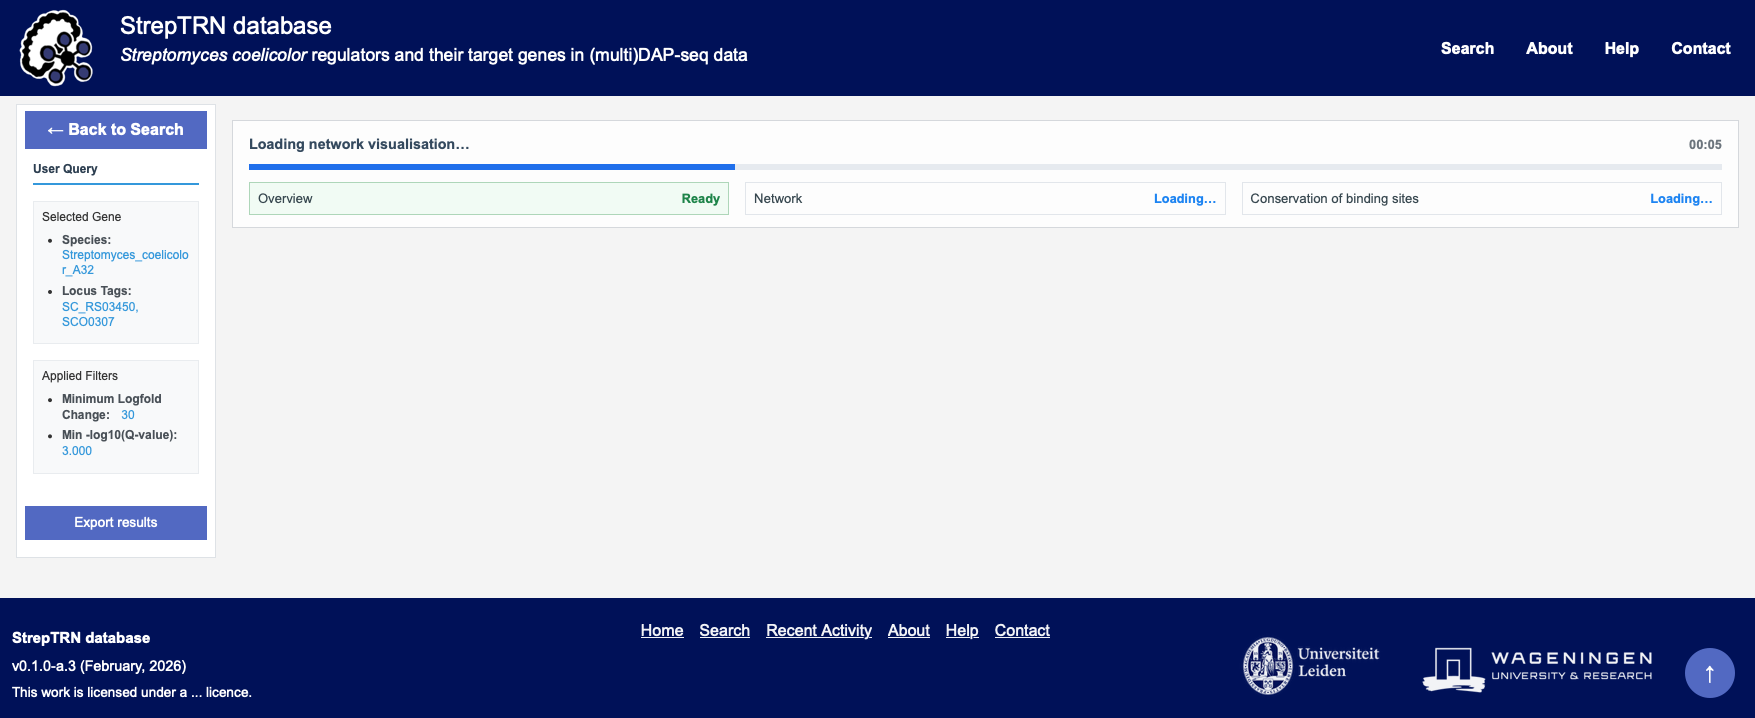
Figure 2 | The loading bar on the Query page, showing the progress of Overview, Network, and Conservation of Binding Events.
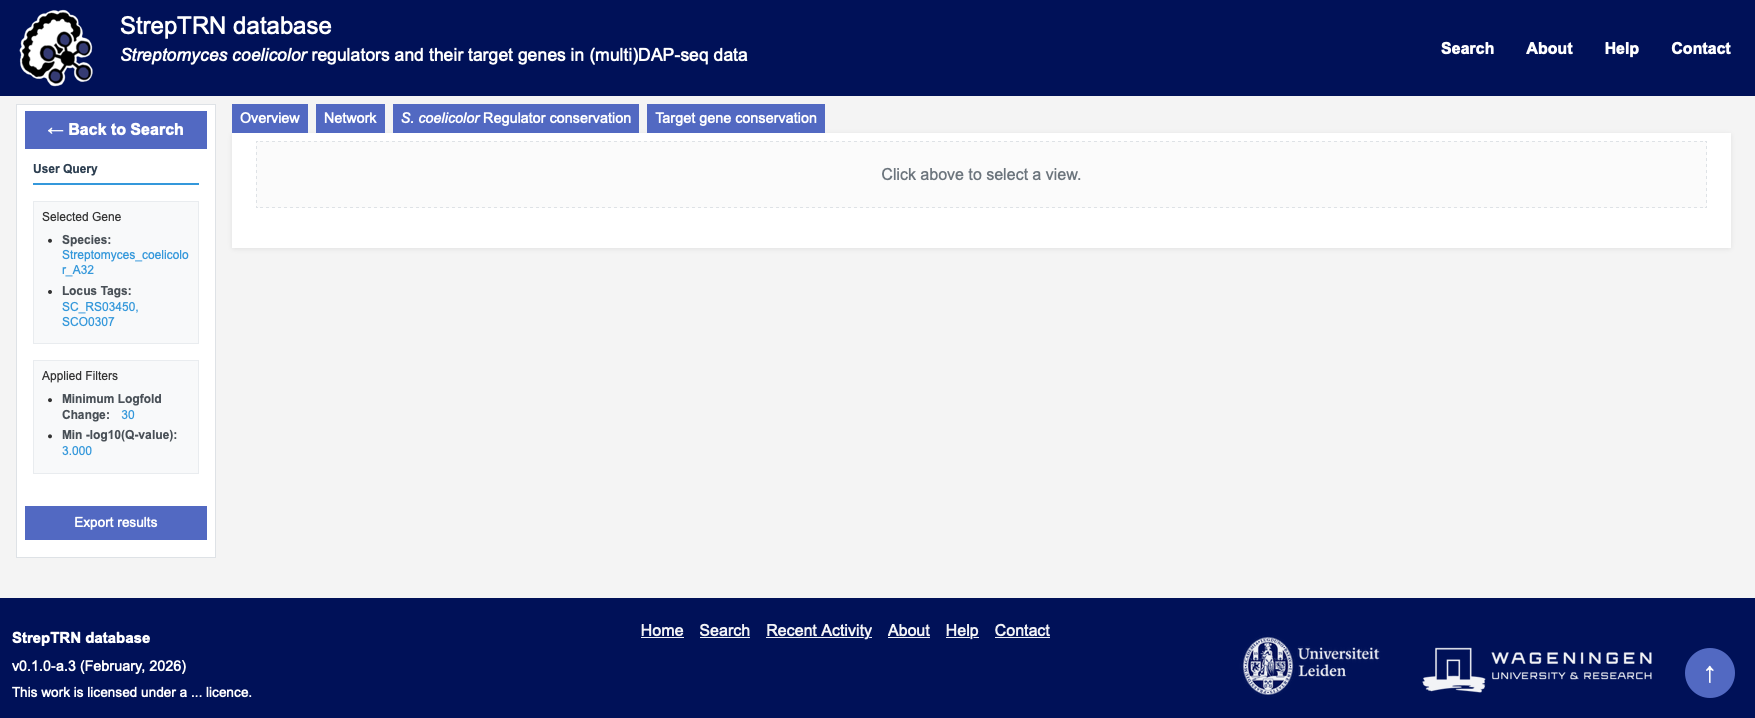
Figure 3 | The tabs on the Query page for the results, after the loading has completed.
Overview
The Overview tab contains information on all relevant peaks where the query gene was observed to be a regulator or target gene, passing the provided filtering thresholds. (Fig. 4). The UI is divided by 1) interactions where the query gene is the regulator, and 2) interactions where the query gene is the target gene. For each type of interaction, a histogram and table display the distribution and details of interactions.
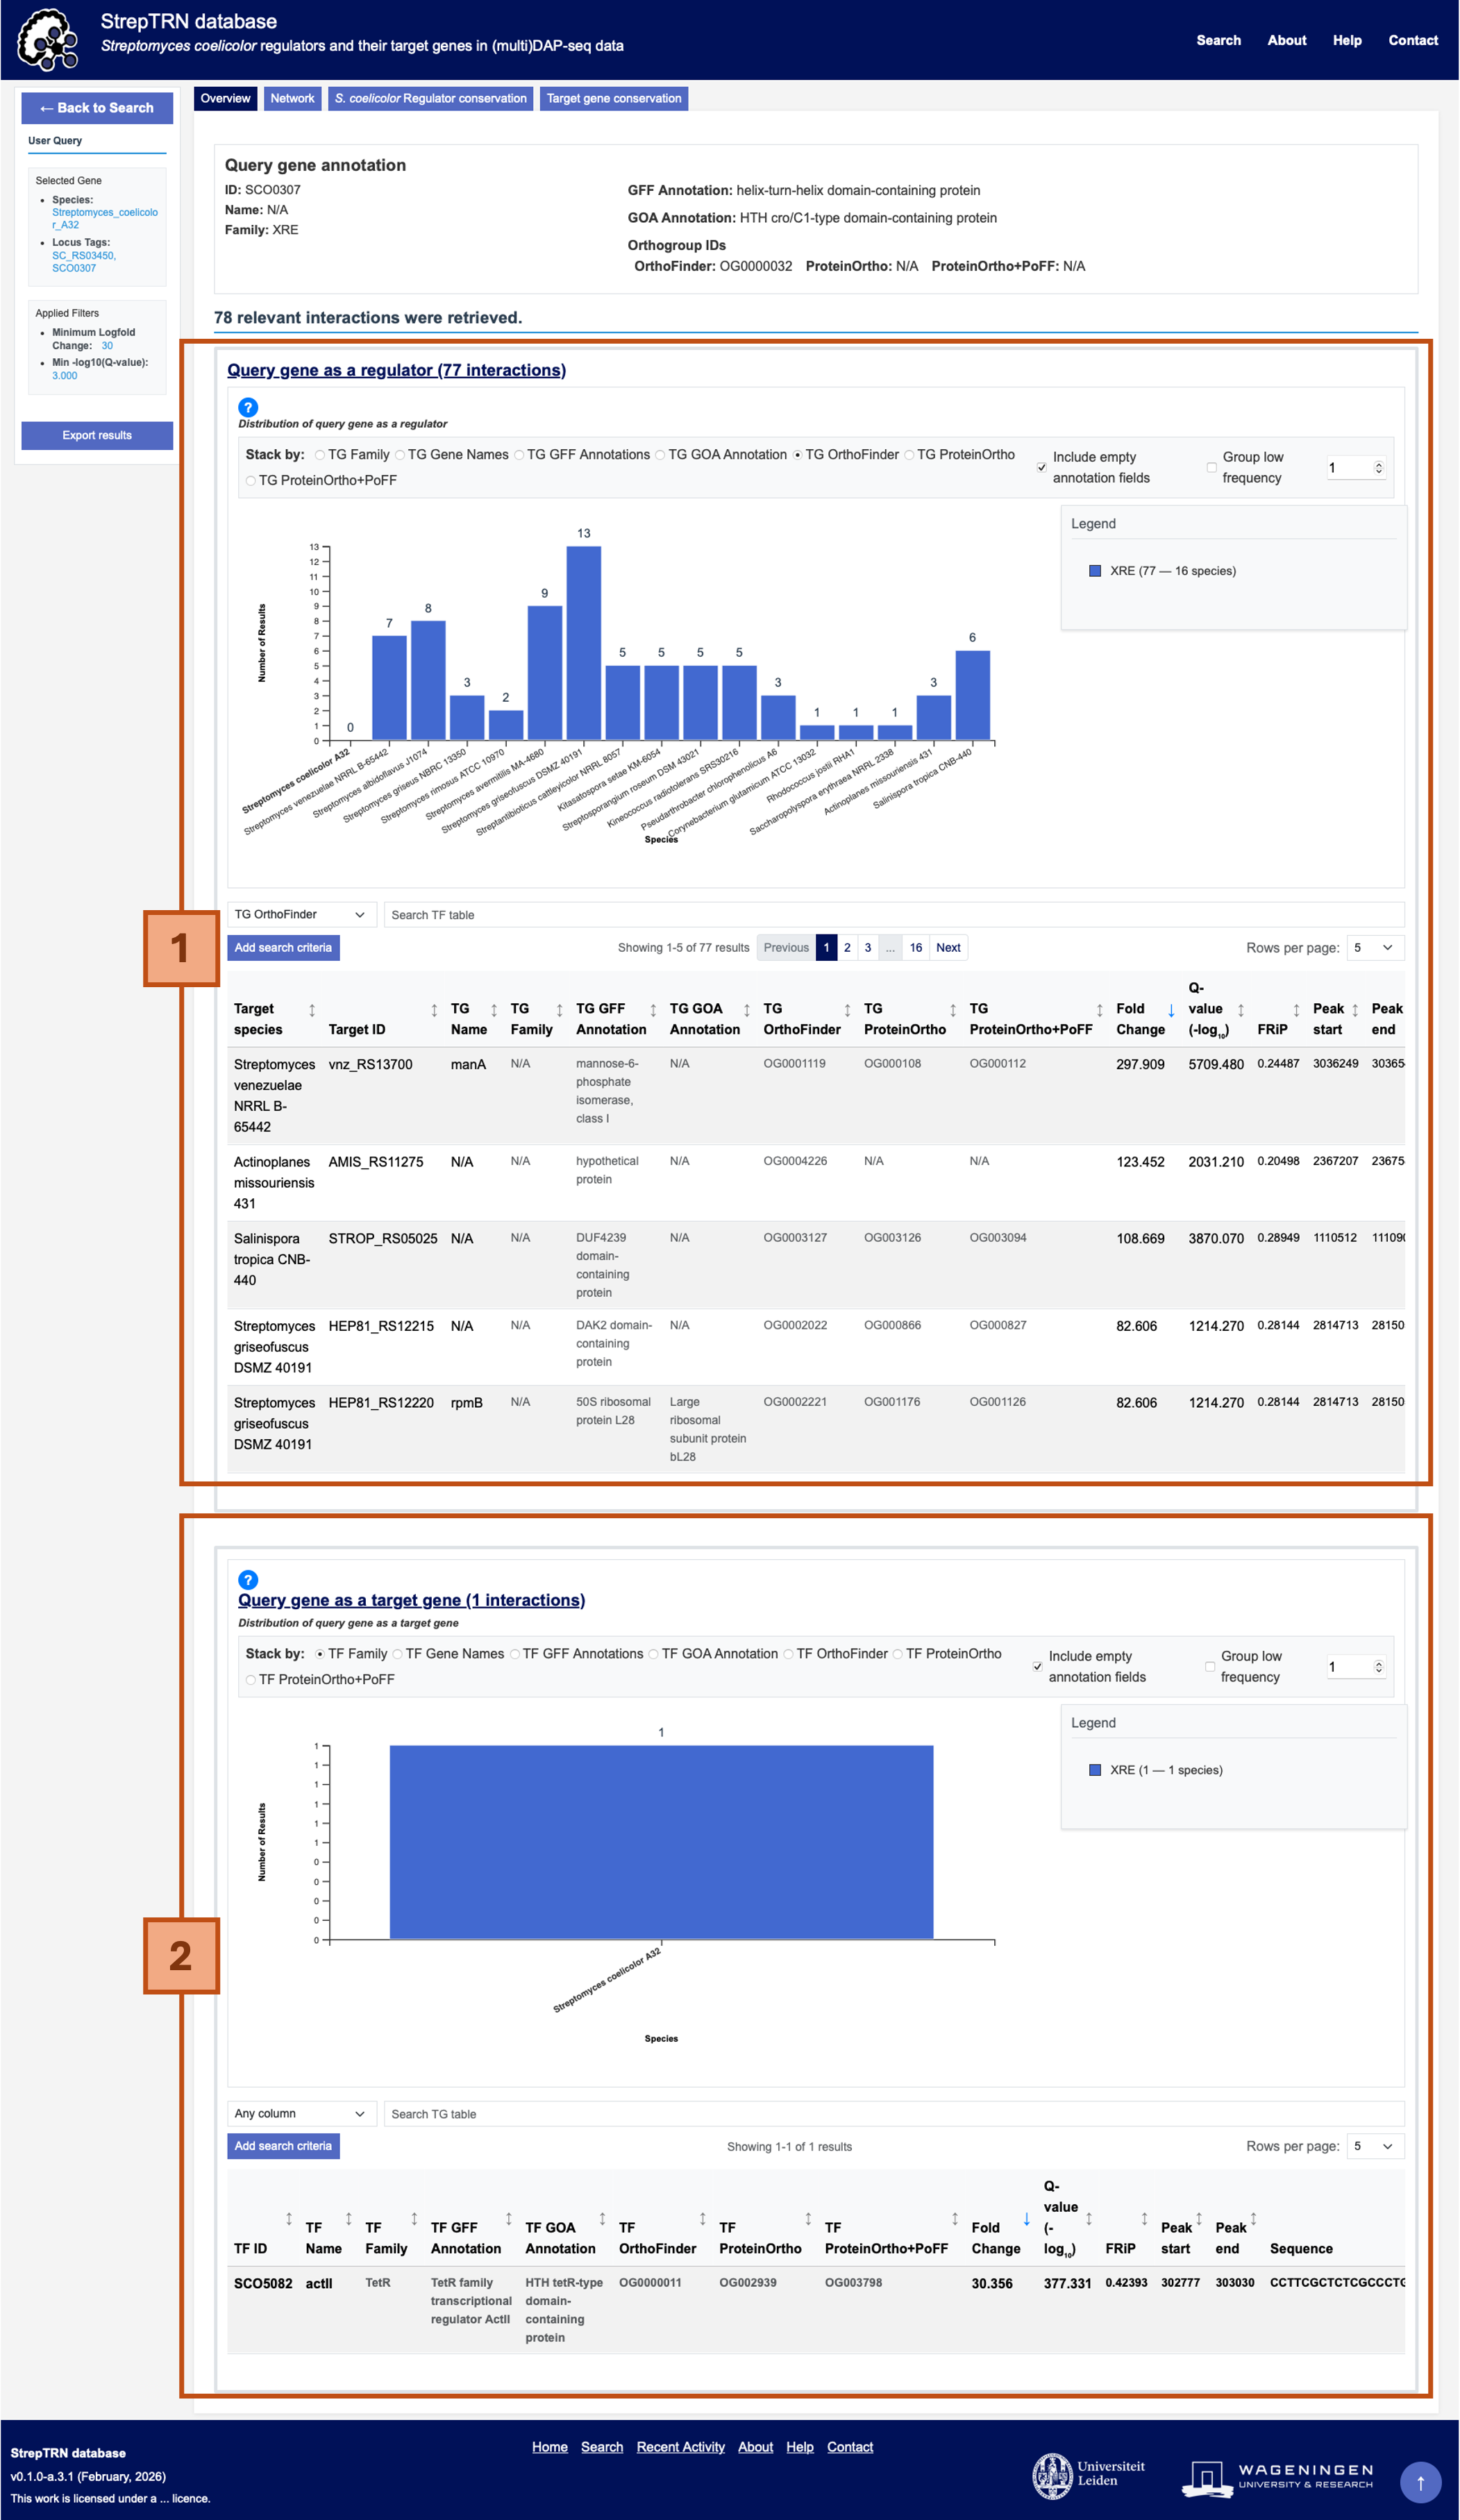
Figure 4 | The Overview tab on the Query page with 1) the histogram showing the distribution of binding events (y-axis) across species (x-axis), and 2) the table with detailed information on the relevant binding events.
Histogram
The histogram UI consists of a control panel, and the plot. In the control panel, you can find options under “Stack by” to colour the histogram bars by the columns of the overview table. Furthermore, you can choose to include or exclude interactions which do not have an annotation in the selected annotation field by toggling the “Include empty annotation fields”. The “group low frequency” option can be used to combine segments that occur in less than X number of species, where X can be specified in the field on the right.The plot viewer shows the plot on the left, and the legend on the right. The species are ordered left to right in increasing phylogenetic distance to S. coelicolor. Hovering over a segment in the plot or an annotation in the legend will highlight all segments with the same annotation (Fig. 5). Furthermore, clicking a segment in the histogram will automatically look up the selected term in the corresponding column in the overview table.
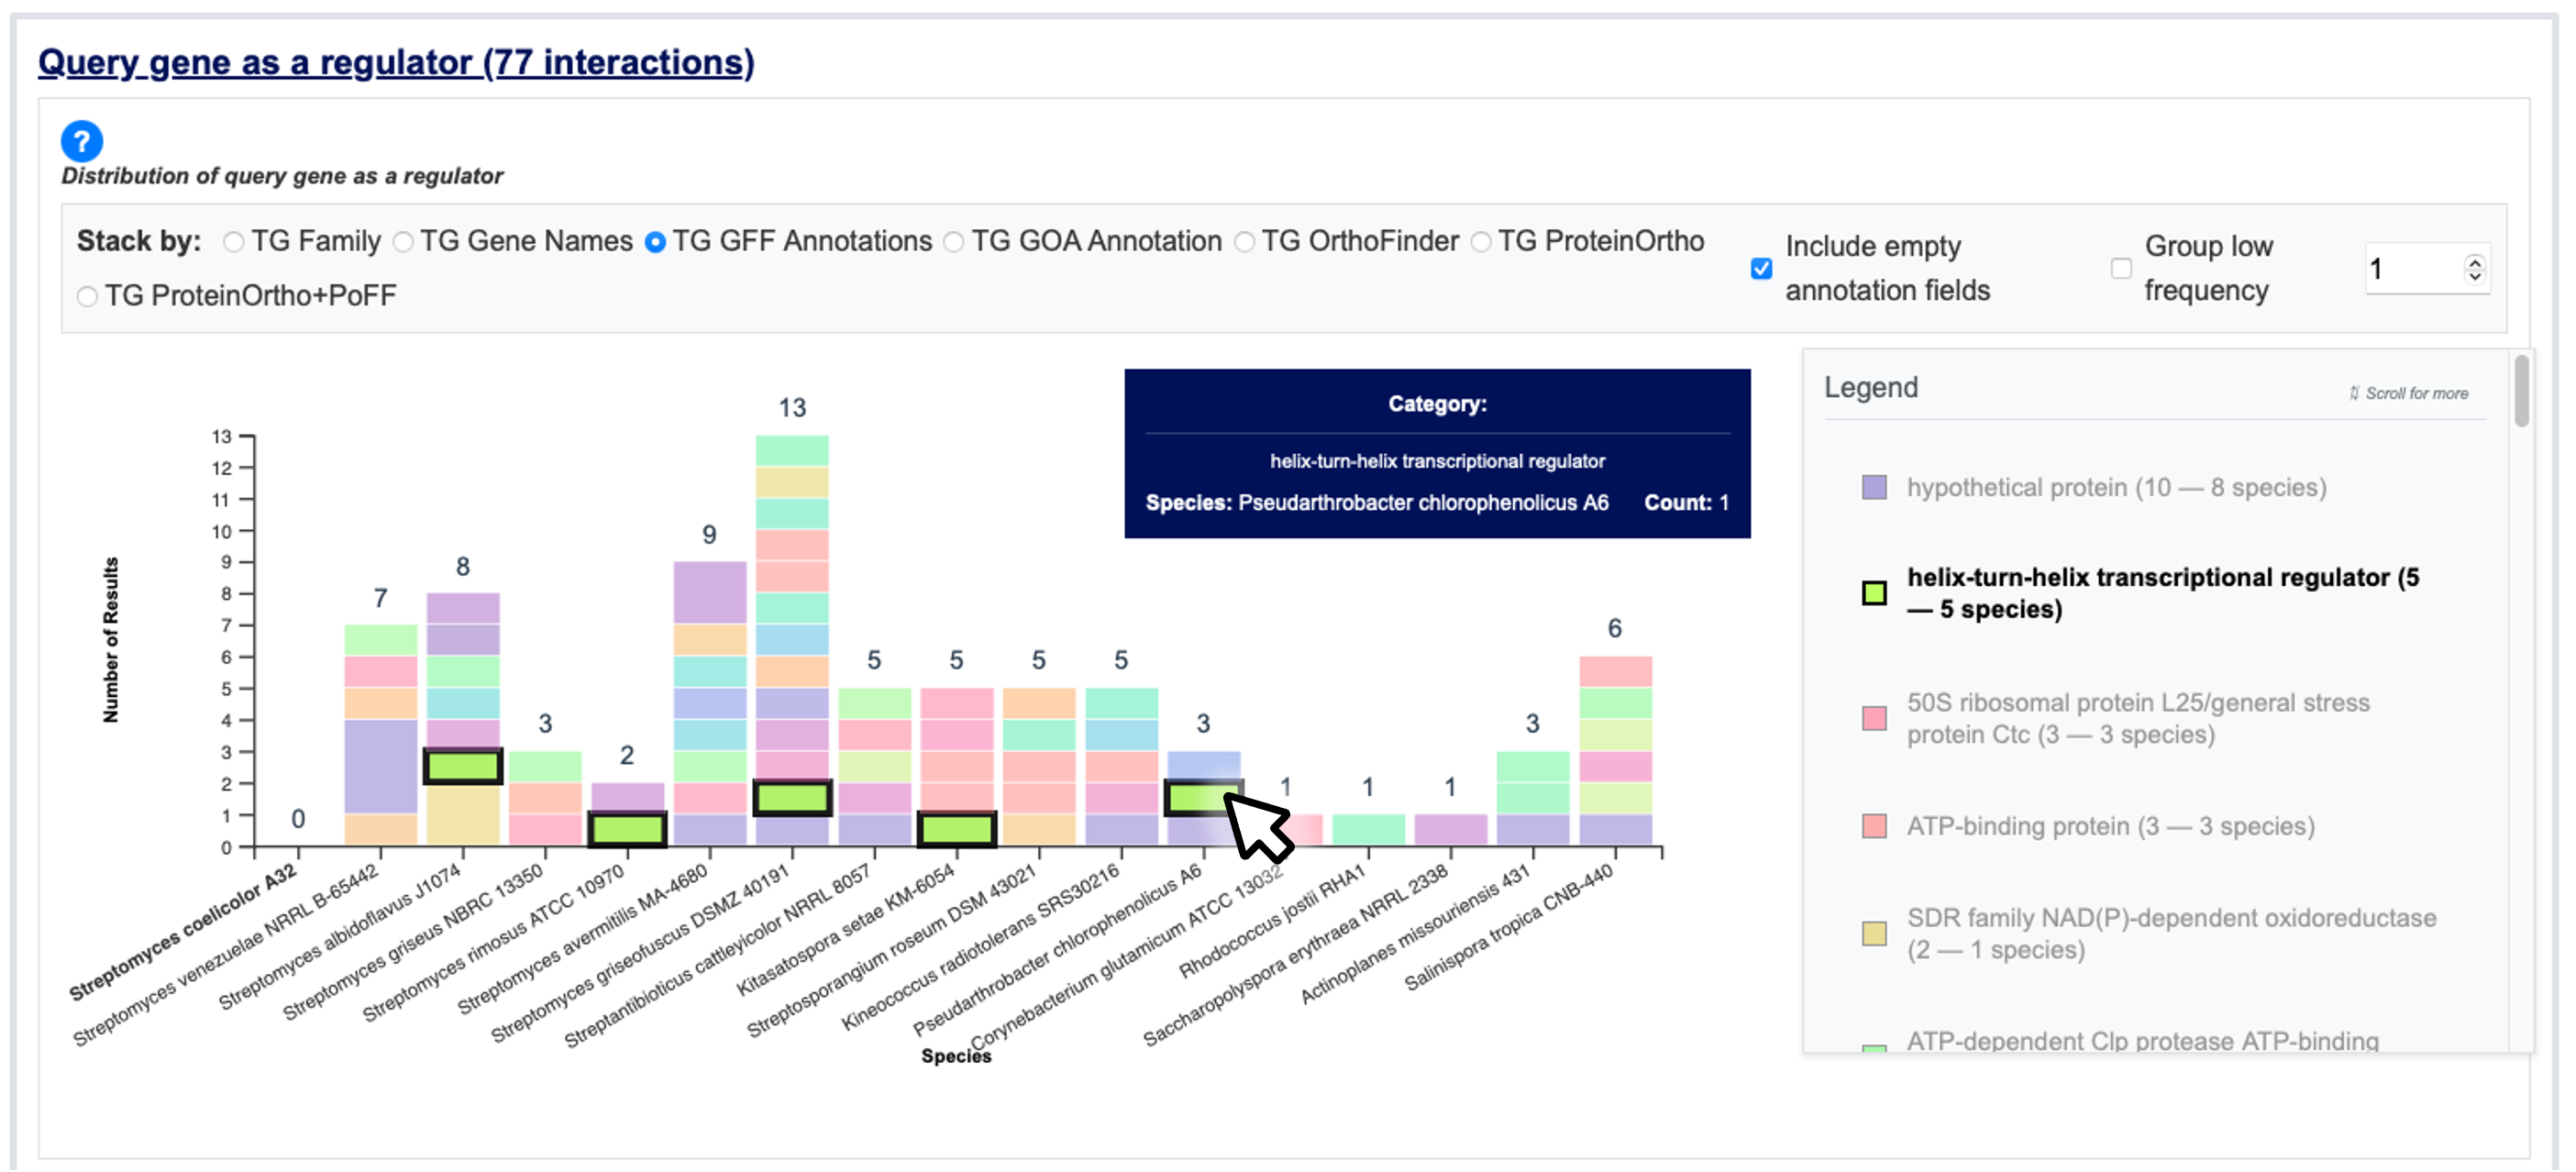
Figure 5 | The histogram under the Overview tab, showing the distribution of binding events (y-axis) across species (x-axis). Hovering over a segment or element in the legend will highlight all segments with the same annotation. Clicking the element will perform an automated search in the Overview table.
Table
In the table, information is shown about the interacting genes. If the query gene is a regulator, details on the target genes will be displayed, and vice versa. Details include annotations, predicted ortholog group, and data on the peak (start and end coordinates, log fold change, q-value, FriP score, genomic sequence). The search bar can be used to look up an interaction with a term of interest. Additionally, the search can be limited to a specific column in the table.Network
The Network tab displays the filtered interactions as a network, including co-regulators of the target genes of the query gene. The UI consists of three elements: the control panel at the top, the species selection on the left, and the network visualisation on the right (Fig. 6).
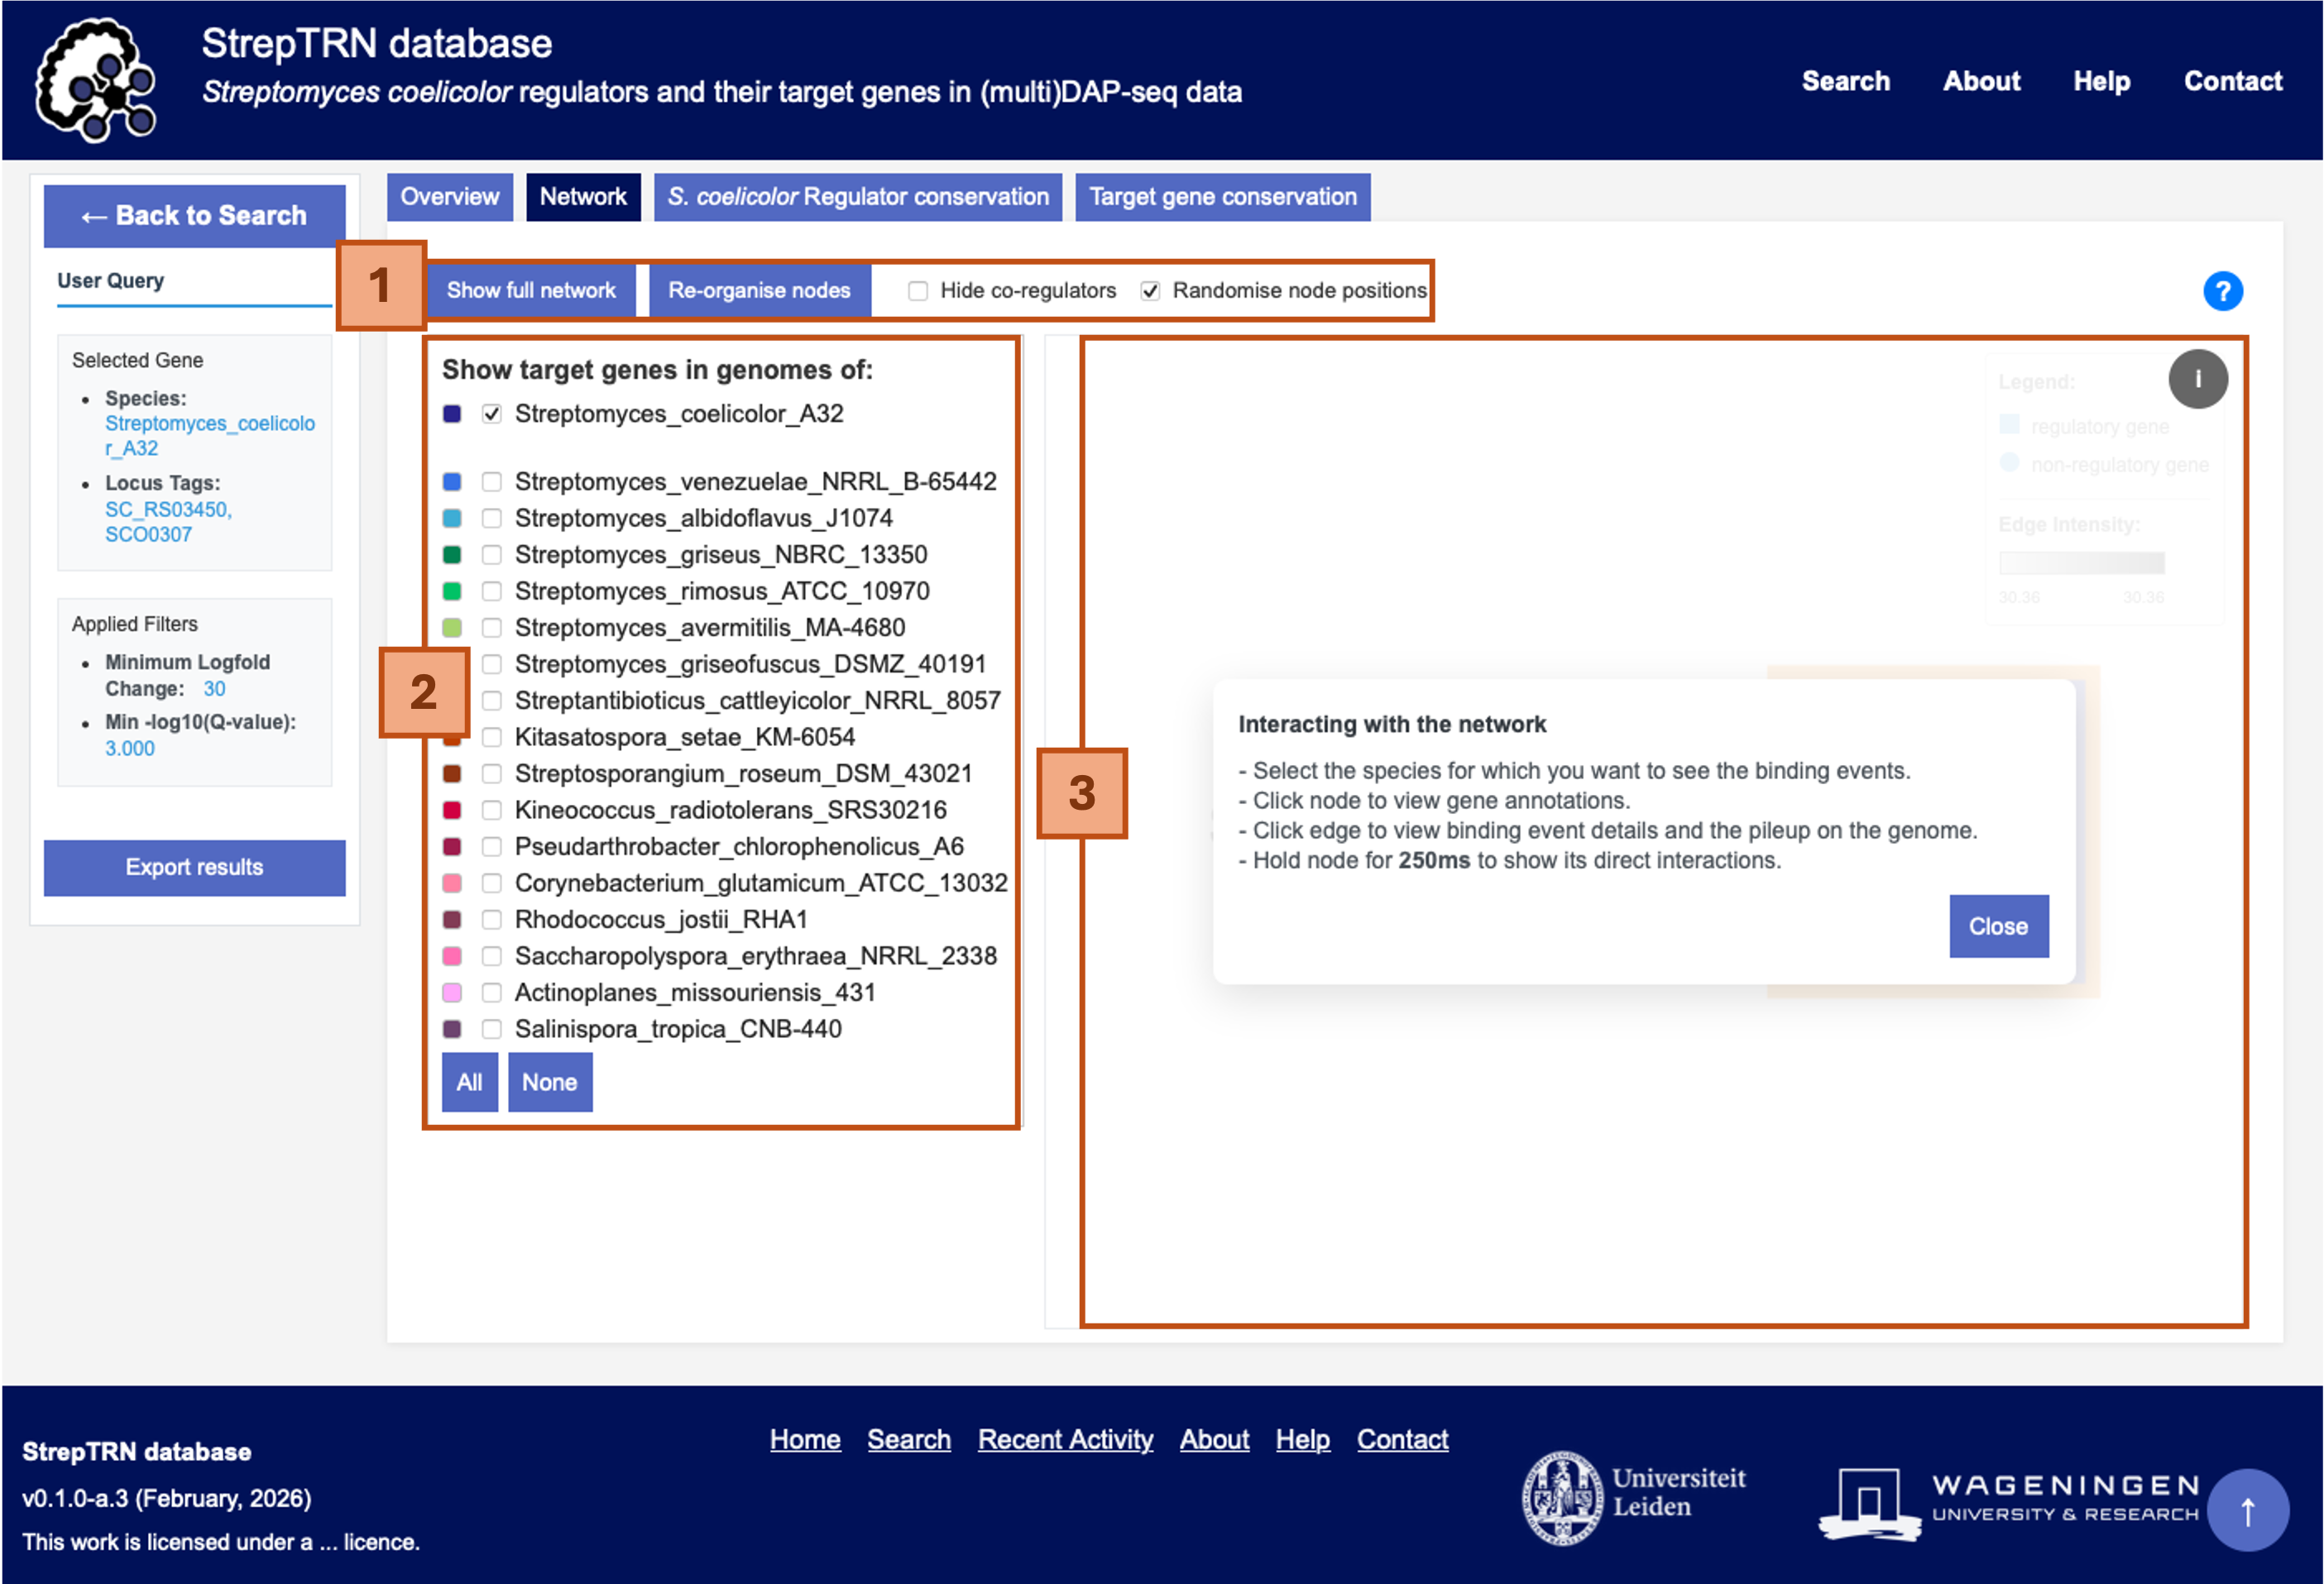
Figure 6 | The Network tab, with 1) controls, 2) a species selector, and 3) the visualisation.
Controls
The Controls panel consists of 4 options:
- Show full network: Button to make all nodes of the selected species appear on screen. Use this button to revert to the full network after viewing a subnetwork.
- Re-organise nodes: Button to re-position the nodes with minimal overlap of nodes and edges.
- Hide co-regulators: Toggle to include or exclude other S. coelicolor regulators that bound near the TSS of the target genes of the query gene.
- Randomise node positions: Toggle to use or ignore the current node positions when re-calculating the optimal positionings.
Species selection
In the Species selection panel, you can select for which species you want to see the genes. The species are ordered from top to bottom in increasing phylogenetic distance to S. coelicolor. The colours to the right of the checkboxes represent the colour of the nodes in the Visualisation panel.
Visualisation
In the Visualisation panel, the relevant regulators and target genes are displayed as a graph. The genes are represented as nodes, where regulators are squares, and non-regulatory target genes are circles. Nodes are coloured by species. The colour is indicated on the left of the species names in the Species selection panel. An edge represents a binding event of the regulator near the TSS of the target gene. The edges are coloured based on the logfold-change of the peak: the darker the peak, the higher the logfold-change. The visualisation panel is interactable in various ways:
- The positions of the nodes can be adjusted by dragging the nodes.
- Holding a node for 250ms will show a subnetwork of the selected node and its direct interactors.
- Gene annotations can be viewed by clicking on a node.
- Information on the binding event can be viewed by clicking on an edge. An overlay will show the following information (Fig. 7):
- The gene annotations of the regulator and target gene. If the binding event occurs in between two genes, both genes will be displayed together.
- A pileup plot showing the coverage of the (signal and background) DAP-seq fragments mapped to the genomic region. The plot also includes the annotated genomic features. Hovering over a genomic feature will show its annotation in the GFF3 file.
- Numeric details on the binding event by MACS3, including the start and end position of the peak, the logfold-change, and the p- and q-value.
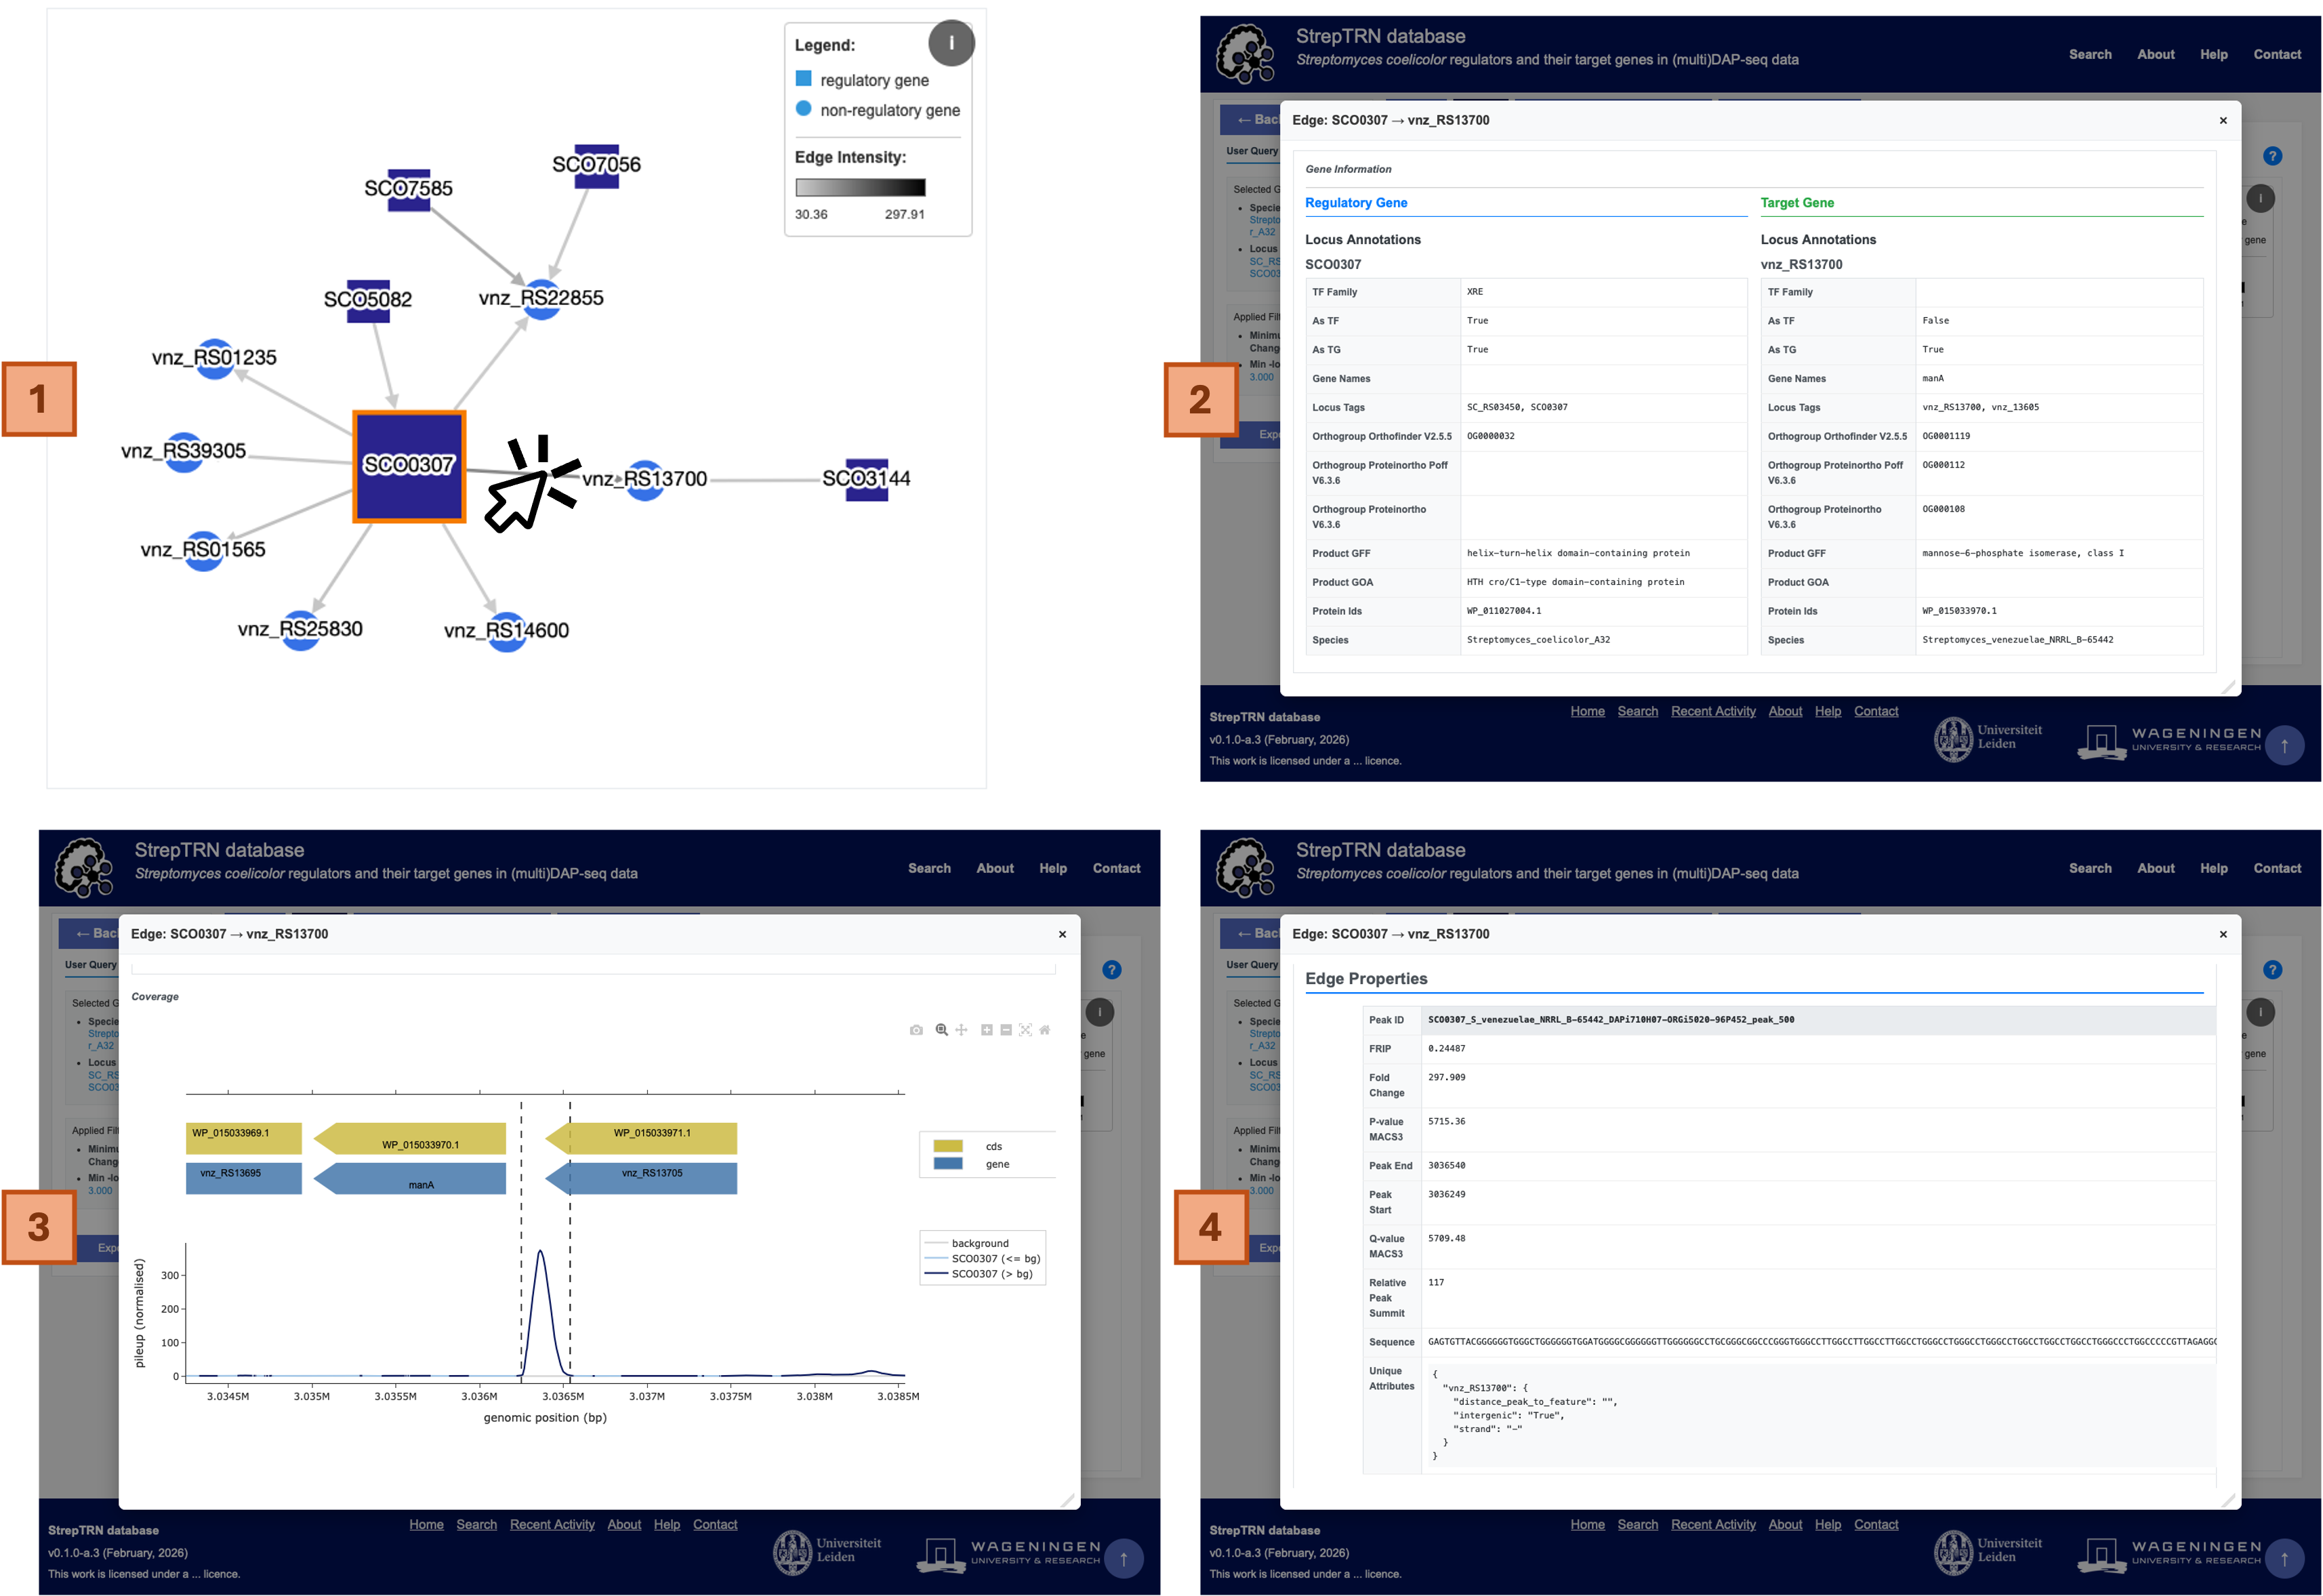
Figure 7 | The information overlay after clicking on an edge in the Network visualisation. 1) Click on an edge to open the overlay. 2) At the top of the overlay, the functional annotations of the genes are displayed. 3) Scroll down to see the pileup plot of the binding event (x-axis: genomic location, y-axis: normalised pileup values). 4) At the bottom, the edge properties are shown, with MACS3-calculated values (e.g., logfold-change, p- and q-value.)
Conservation
The occurrence of binding events between orthologous genes and the query gene can be viewed in the S. coelicolor regulator conservation and Target gene conservation tabs. In the S. coelicolor regulator conservation tab, it is shown whether the observed regulators of the query gene also bound near the transcription start site of an ortholog of the query gene (Fig. 8a). In the Target gene conservation tab, the matrix shows whether the query gene also bound near the transcription start site of an ortholog of the target gene (Fig. 8b). The UI for both conservation tabs are similar, consisting of a presence/absence plot, a legend and a matrix cell annotation element (Fig. 8c)
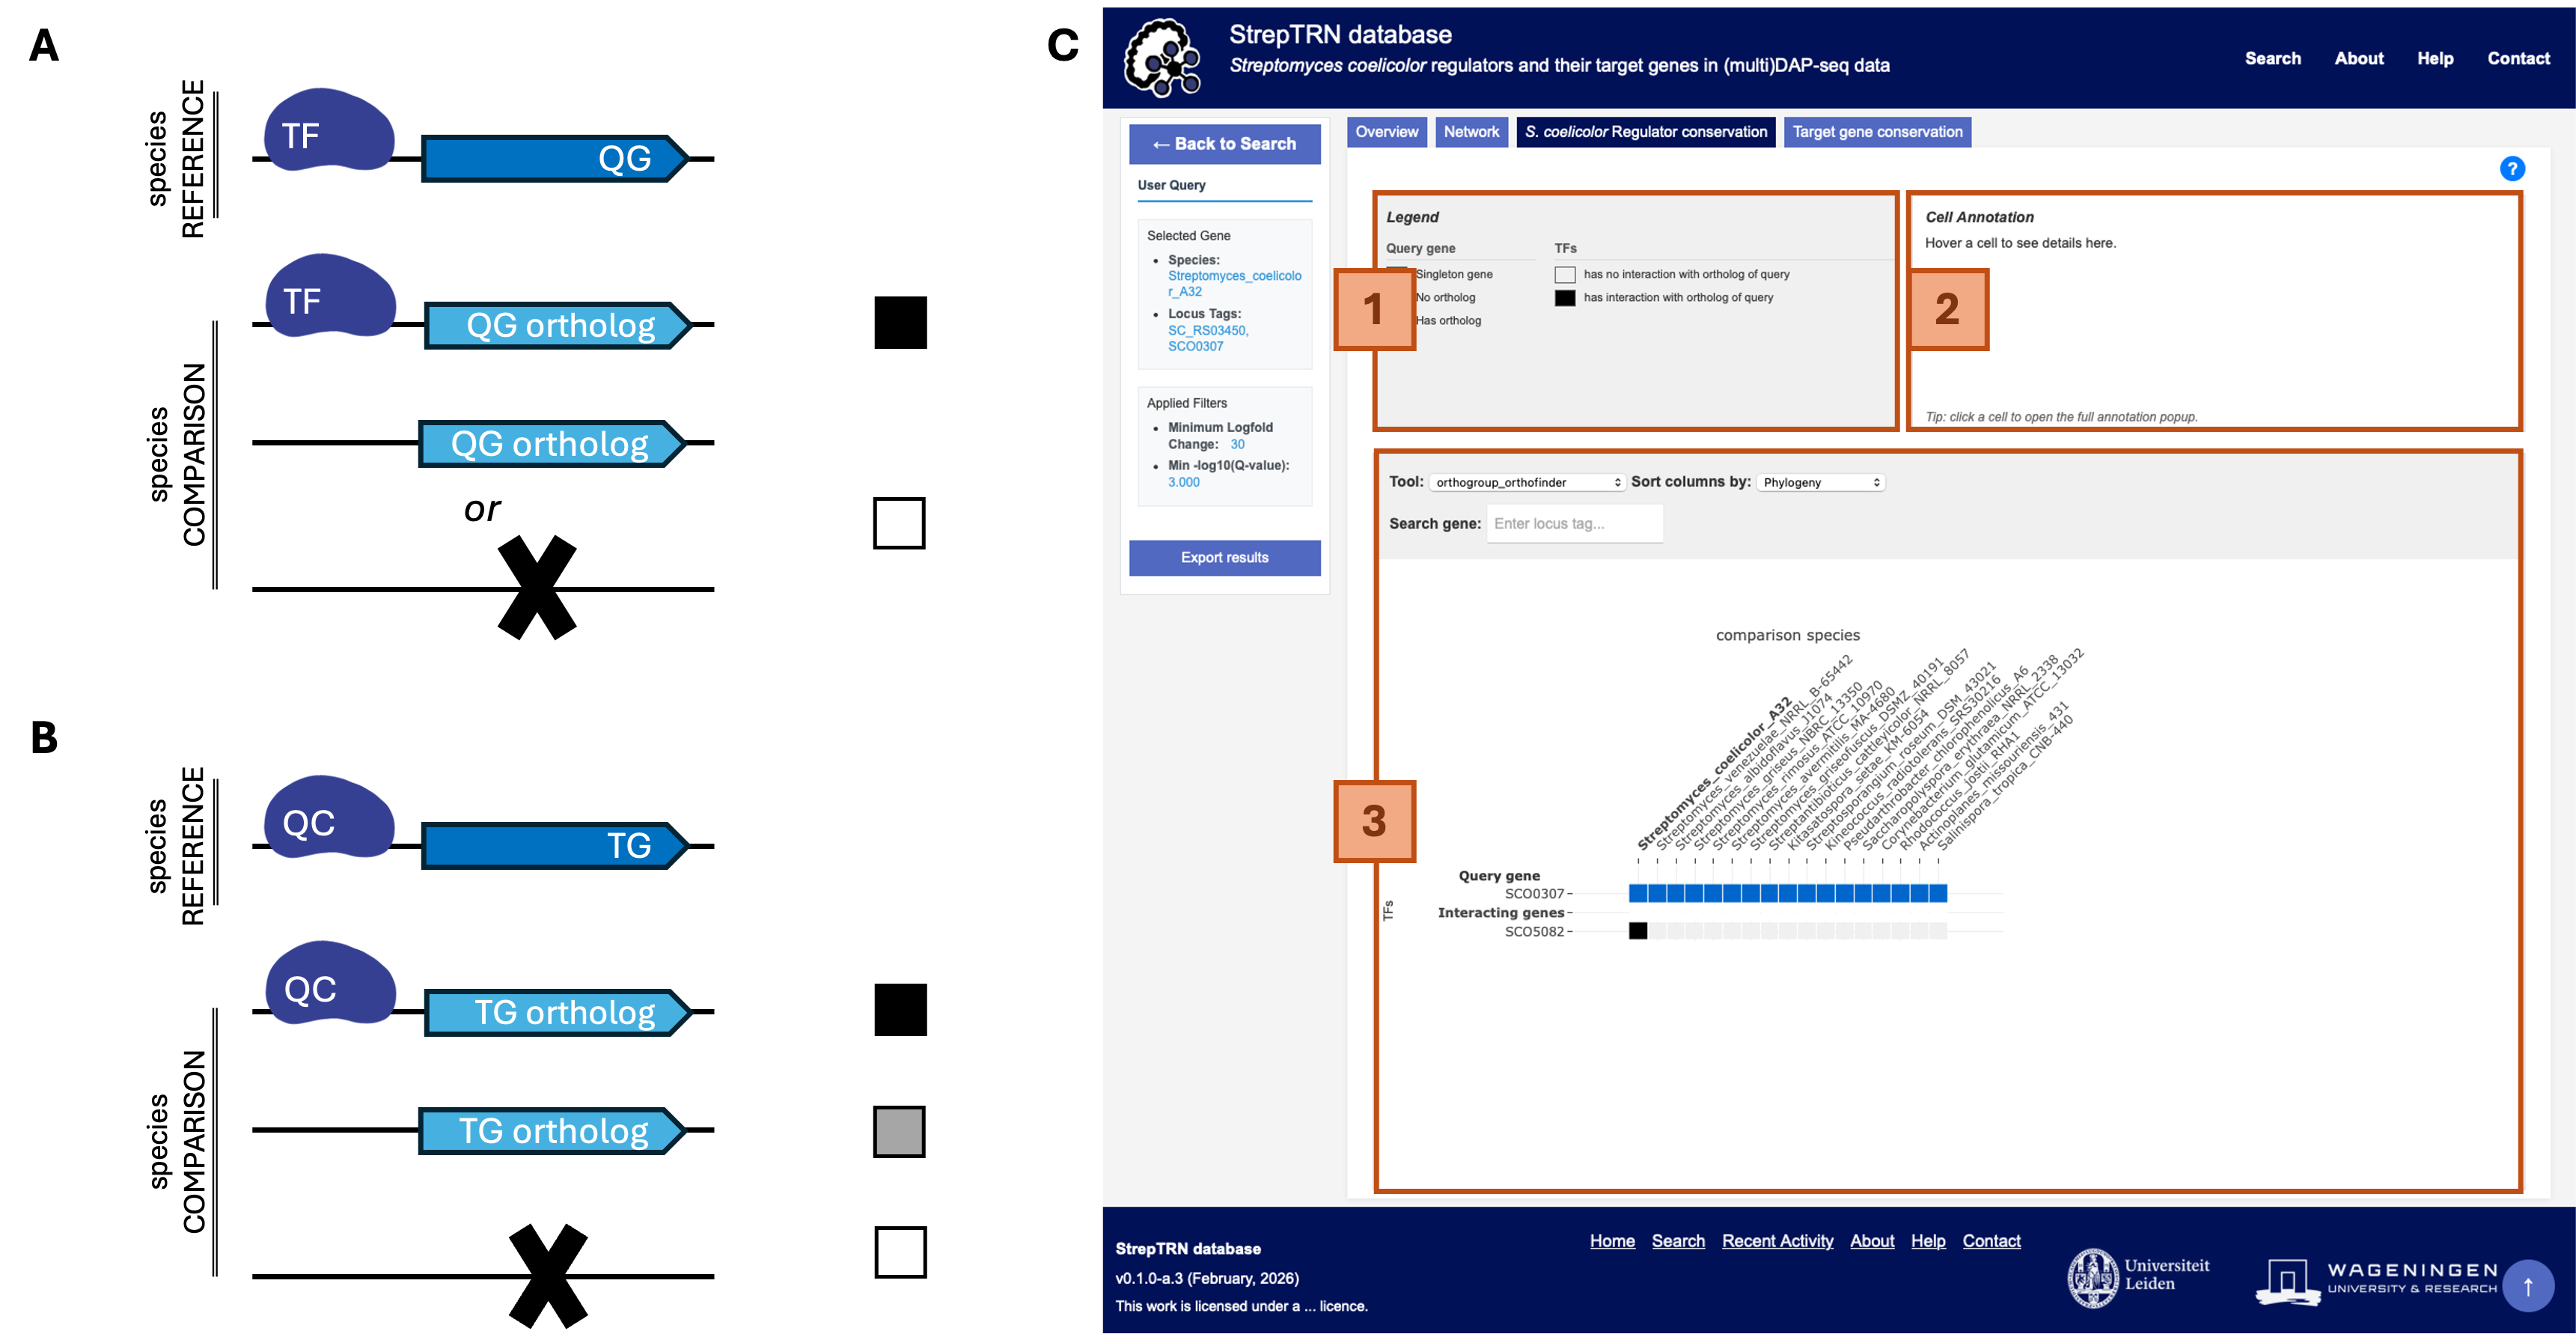
Figure 8 | An overview of the information shown in the S. coelicolor regulator conservation and Target gene conservation tabs. A) Diagram of which interactions the colours in the regulator conservation plot represent. B) Diagram of which interactions the colours in the target gene conservation plot represent. C) Screenshot of the regulator conservation tab, with 1) the legend, 2) the matrix cell annotation element, and 3) the presence/absence plot (x-axis: species, y-axis: genes). TF = transcription factor; QC = query gene; TG = target gene
- Legend: Explanation on the colours of the cells in the presence/absence plot. "singleton" means that for the given gene, no orthologs were predicted in any of the species.
- Cell annotation: Hover over a cell in the presence/absence plot to display the orthologs of the inspected gene.
- Presence/absence plot: The matrix showing whether
binding events have been observed with orthologs in other
species. Clicking on a cell will show the list of orthologs in detail.
Above the plot, you can find a controls panel with the following options:
- Reference species (Target gene conservation tab only.): Dropdown box in which you can select for which species you want to see the binding events of the query gene. In the S. coelicolor regulator conservation tab, this is fixed to S. coelicolor.
- Tool: Dropdown box to select which tool's orthology predictions should be shown.
- Sort columns by: Dropdown box to select whether to sort the columns by phylogeny (in increasing phylogenetic distance (left to right)), or regulon similarity (= most similar regulon compared to that in the reference species).
- Search gene: Input field to highlight the provided gene ID in the plot.